LAV PRATAP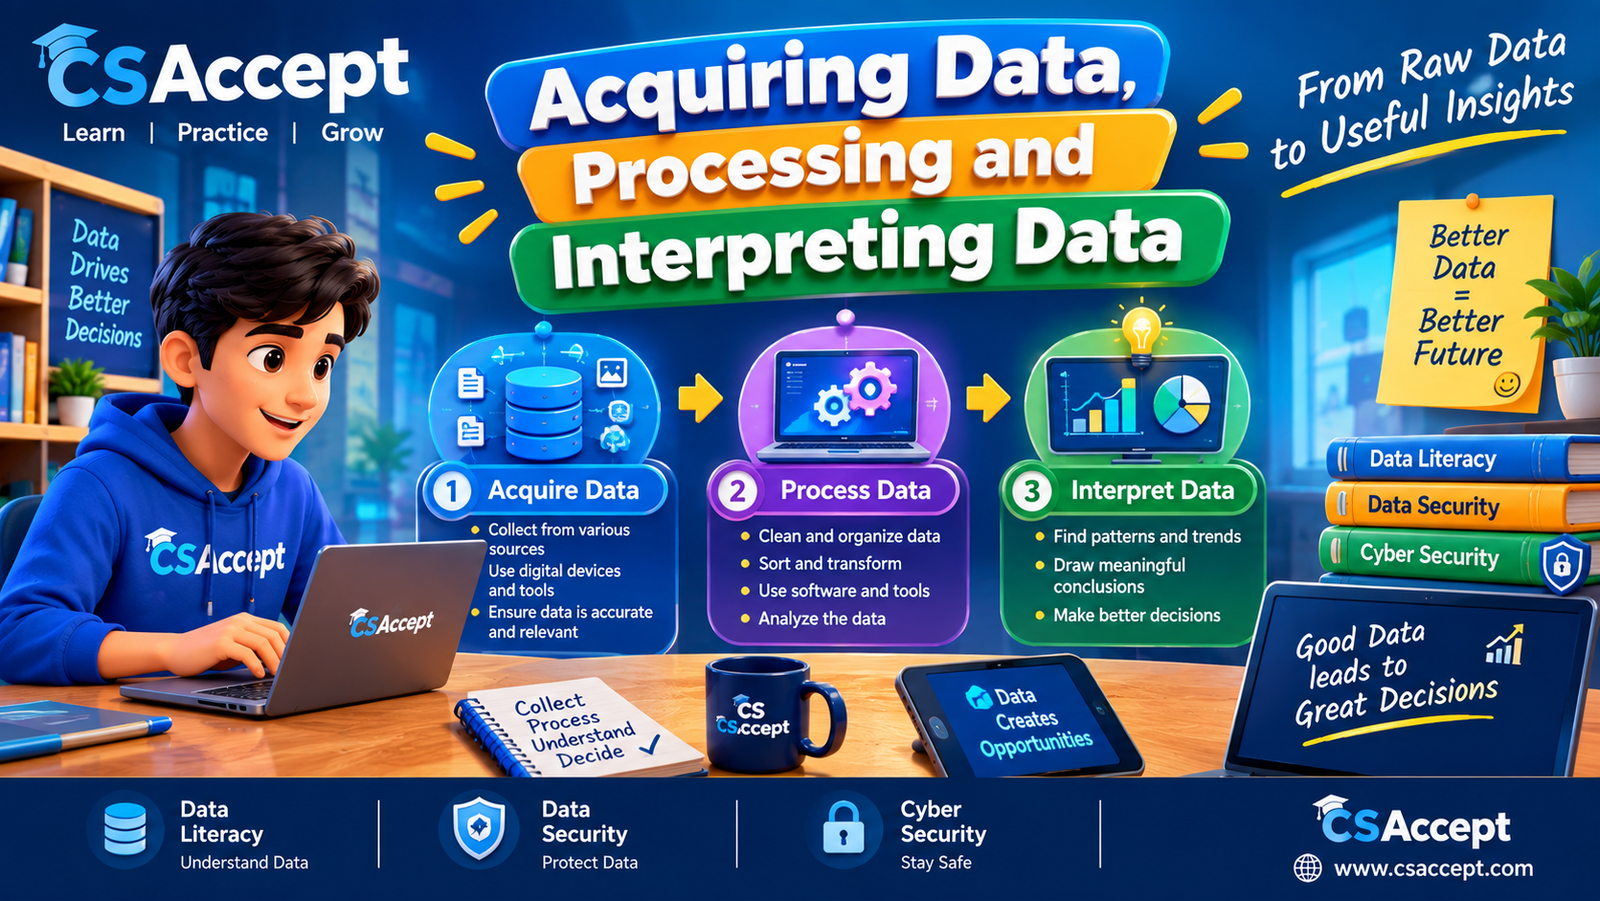
csaccept.com is a computer awareness website dedicated to providing reliable and easy-to-understand information about computer technology and digital safety. The website focuses on educating students, beginners, and general users about computer basics, cyber security, emerging technologies, and practical IT skills. Through informative articles, quizzes, and real-life examples, csaccept.com aims to increase digital literacy and help users stay safe and confident in today’s technology-driven world.
 Facebook ………………..
  Instagram ……………..
  Twitter ( X ) ……………..
  YouTube
Artificial Intelligence / Data Literacy
Acquiring Data, Processing and Interpreting Data
-
Acquiring Data
Data acquisition means collecting data from different sources for a specific purpose.
For example, if we want to know which subject students like most, we can collect information by asking students to fill out a survey.
Steps involved in acquiring data
- Identify the purpose – Decide why the data is required.
- Identify the required data – Decide what information needs to be collected.
- Select the source – Decide where the data will come from.
- Collect the data – Use surveys, interviews, observations, etc.
- Store the data – Save the collected data in a proper format.
Example
Purpose: To find the favorites sport of students.
| Student | Favorites Sport |
| Rahul | Cricket |
| Anjali | Badminton |
| Aman | Football |
| Priya | Cricket |
This table contains the collected data.
-
Best Practices for Acquiring Data
While collecting data, we should follow some good practices.
- Define the purpose clearly
Know exactly why the data is required.
- Collect relevant data
Collect only the information needed for the task.
- Use reliable sources
Data should come from trustworthy sources.
- Avoid bias
Questions and methods should not unfairly influence the results.
- Respect privacy
Personal information should be collected and used responsibly.
- Take consent when required
People should know why their information is being collected.
- Ensure accuracy
Check the data for mistakes while collecting it.
- Keep data secure
Protect data from unauthorized access or misuse.
- Record data systematically
Use tables, spreadsheets, databases, or other organized formats.
-
Features / Characteristics of Good Data
Good data should have certain characteristics.
- Accuracy
Data should be correct and free from errors.
- Relevance
Data should be related to the purpose.
- Completeness
Important required information should not be missing.
- Consistency
Data should follow the same format and rules.
- Timeliness
Data should be up-to-date.
- Reliability
Data should come from a trustworthy source.
- Accessibility
Authorized users should be able to access the data when needed.
Example
If a school wants to analyses current student attendance, attendance data from five years ago would not be very useful.
- Data Preprocessing
Data preprocessing is the process of cleaning and preparing raw data before it is analysed or used by a computer system.
Raw data may contain:
- Missing values
- Duplicate records
- Spelling mistakes
- Incorrect values
- Different formats
- Unnecessary information
Main steps of data preprocessing
Raw Data → Cleaning → Organizing → Transforming → Ready for Analysis
- Data Cleaning
Removing or correcting errors from data.
Example:
Before:
14, 15, 16, “fifteen”, 17
After:
14, 15, 16, 15, 17
- Removing Duplicates
Repeated records are identified and removed.
- Handling Missing Values
Missing information can be:
- Filled using appropriate values
- Obtained again
- Left blank when appropriate
- Removed if necessary
- Standardizing Data
Putting data into a common format.
Example:
Male, M, male
can be standardized as:
Male
- Importance of Data
Data plays an important role in our daily lives and in Artificial Intelligence.
Importance of data:
- Helps in decision-making
- Helps identify patterns and trends
- Supports scientific research
- Helps businesses understand customers
- Improves educational planning
- Helps AI systems learn
- Helps predict future outcomes
- Helps solve problems
Example
A school can analyses students’ examination data to identify subjects where students need additional support.
- Processing Data
Data processing means converting raw data into a meaningful and useful form.
Basic process:
Data Collection → Data Cleaning → Data Processing → Analysis → Interpretation → Decision
Example
Suppose the marks of five students are:
70, 80, 90, 60, 75
After processing, we can calculate:
- Total marks
- Average marks
- Highest marks
- Lowest marks
This makes the raw data more useful.
- Data Interpretation
Data interpretation means understanding and explaining what the processed data tells us.
It helps us answer questions such as:
- What does the data show?
- What pattern can we identify?
- What conclusion can we draw?
- What decision can be made?
Example
Suppose the marks are:
| Student | Marks |
| A | 60 |
| B | 75 |
| C | 90 |
| D | 80 |
| E | 95 |
From this data, we can interpret:
Student E obtained the highest marks, while Student A obtained the lowest marks.
- Ways to Interpret Data
Data can be interpreted using:
- Tables
Tables arrange data in rows and columns.
- Bar Graph
Used to compare different categories.
Example:
- Number of students in different classes
- Number of students choosing different subjects
- Pie Chart
Used to show parts of a whole, usually in percentages.
- Line Graph
Used to show changes or trends over time.
Example:
- Temperature over seven days
- Monthly school attendance
- Histogram
Used to represent the distribution of numerical data.
- Tools Used for Data Interpretation
Several digital tools can be used to process and interpret data.
- Microsoft Excel
Used for:
- Entering data
- Calculations
- Sorting and filtering
- Creating charts and graphs
- Analyzing data
- Google Sheets
An online spreadsheet tool used to:
- Store data
- Perform calculations
- Create charts
- Collaborate with others
- Microsoft Power BI
Used for:
- Data analysis
- Interactive dashboards
- Charts and visualizations
- Reporting
- Tableau
A data visualization tool used to create:
- Graphs
- Charts
- Dashboards
- Reports
- Python
Python can be used for:
- Data processing
- Data analysis
- Visualisation
- AI and Machine Learning
Some commonly used Python libraries are:
- Pandas – data handling
- NumPy – numerical operations
- Matplotlib – graphs and charts
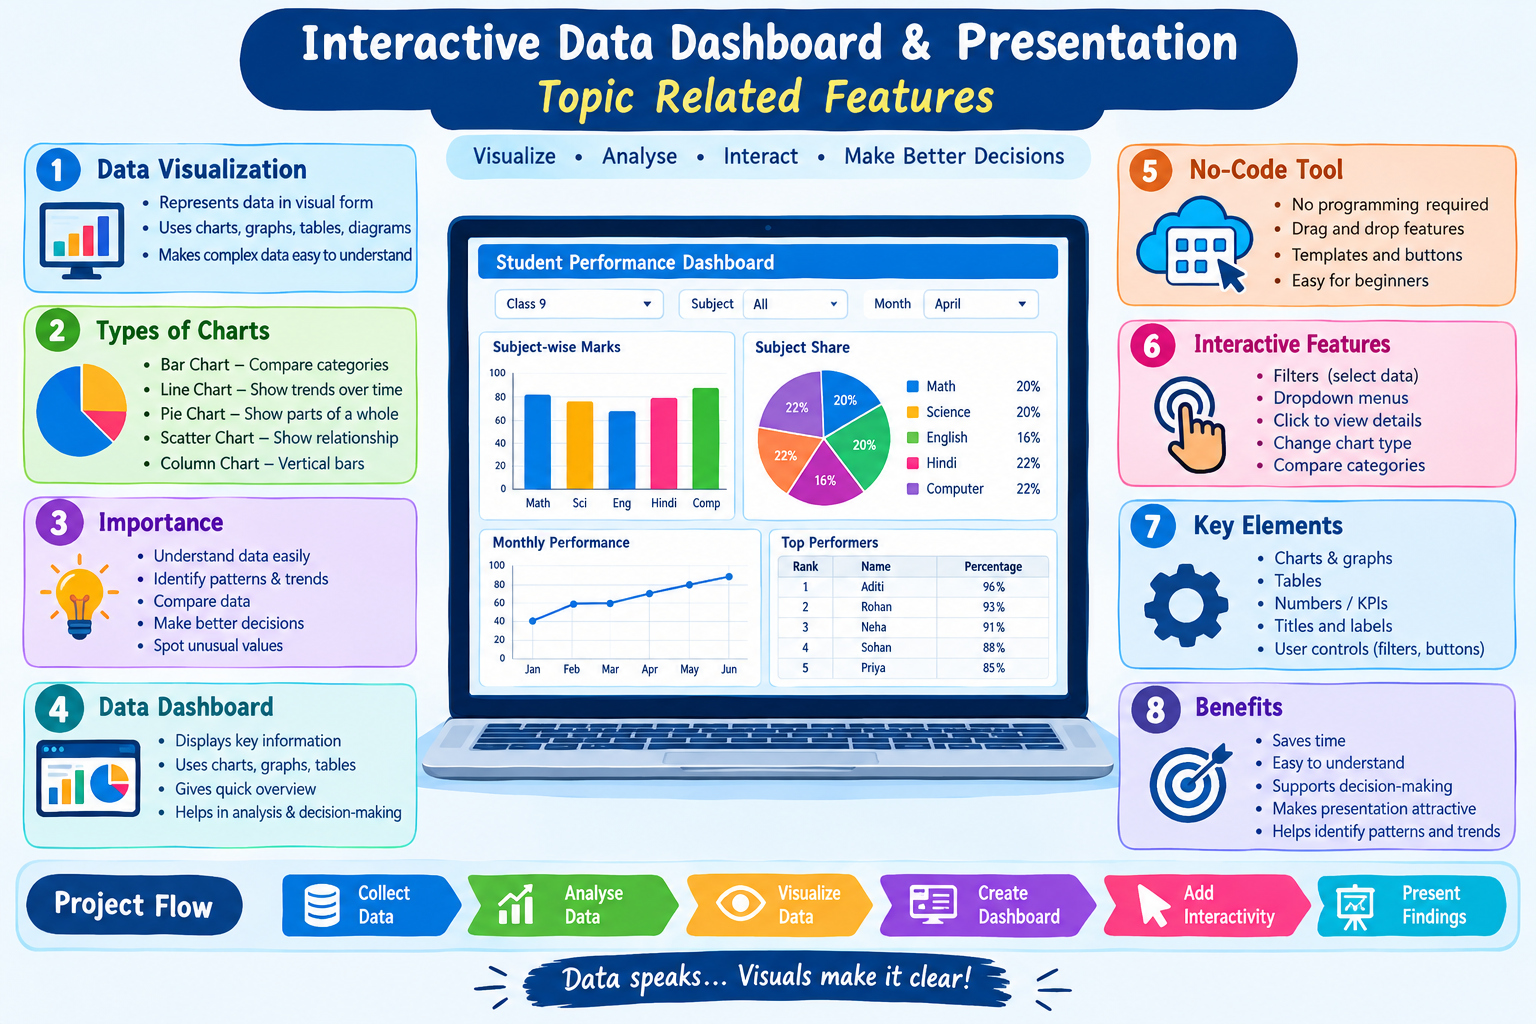
- Data Visualisation
Data visualization means representing data using graphs, charts, diagrams, or other visual forms.
It makes complex information easier to understand.
Example
Instead of writing:
Class 6 = 40 students
Class 7 = 45 students
Class 8 = 38 students
Class 9 = 42 students
we can represent the information using a bar graph.
Benefits of data visualization
- Easy to understand
- Helps identify patterns
- Helps compare information
- Makes trends visible
- Supports better decision-making
- Data in Artificial Intelligence
Data is extremely important in Artificial Intelligence (AI).
AI systems use data to learn patterns and make predictions or decisions.
Example: Face Recognition
A face-recognition system may be trained using many images of faces.
Images → Data Processing → AI Training → Pattern Recognition → Prediction
Example: Recommendation Systems
Online platforms can use information about users’ previous activities to recommend:
- Videos
- Music
- Products
- Articles
Therefore:
Data is one of the most important resources for Artificial Intelligence.
- Data Processing Cycle
You can remember the complete process as:
COLLECT → CLEAN → PROCESS → ANALYSE → INTERPRET → DECIDE
| Stage | Meaning |
| Collect | Gather data |
| Clean | Remove errors |
| Process | Organize and transform |
| Analyze | Find patterns and relationships |
| Interpret | Understand the results |
| Decide | Use results for decision-making |
- Important Terms for Examination
Data: Raw facts and information.
Data Acquisition: Process of collecting data.
Primary Data: Data collected directly for a specific purpose.
Secondary Data: Data collected previously by another person or organization.
Data Processing: Converting raw data into a useful form.
Data Preprocessing: Cleaning and preparing data before analysis.
Data Interpretation: Understanding and explaining the meaning of data.
Data Visualisation: Representing data using graphs, charts, and diagrams.
Qualitative Data: Non-numerical data describing qualities or characteristics.
Quantitative Data: Numerical data that can be counted or measured.